Thematic research data commons is:
Planet
Workshop Addresses Wildlife Camera Trap, Ecoacoustic and Drone Data Challenges
Exploreabout Workshop Addresses Wildlife Camera Trap, Ecoacoustic and Drone Data Challenges
As part of our Research Software Agenda for Australia, the ARDC is working with the research community to shape better research software in order to recognise it as a first-class output of research. This interview is part of a series about research software engineers in Australia. Each month we talk to a leading research software engineer about their experiences and best-practice tips in creating, sustaining and improving software for research.
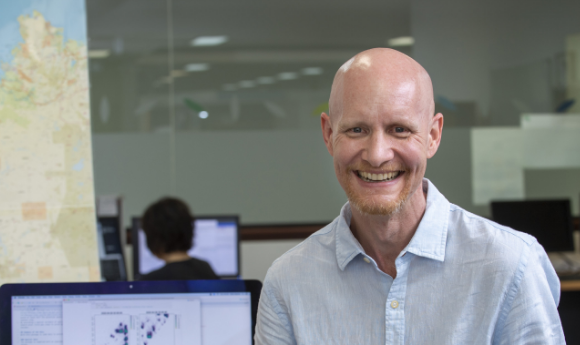
Continuing the series, we spoke with Dr Adam Sparks, a bioeconomic modeller with Western Australia’s Department of Primary Industries and Regional Development (DPIRD). He leads the Systems Modelling branch in the DPIRD’s Farming Systems Innovation Directorate. In this interview, we talked about the work of his team of 12, which includes data scientists, climatologists, meteorologists, biometricians and software developers.
The Systems Modelling branch has quite a mix of interesting backgrounds. It includes 6 modellers, research software engineers and data scientists – Dr Rodrigo Pires, Anna Hepworth, Matt Foster, Kenyon Ng, Jimmy Ng and Matthew Antulov. Rodrigo and Anna are senior modellers that work on developing agricultural system models and models for agricultural decision support tools. Rodrigo has a background in applied agronomy and plant sciences, and Anna has a statistics background in human health.
Matthew Antulov, on the other hand, programs in Julia in a cloud-hosted environment using Docker to build large Monté Carlo whole-farm simulation models using real farm data. Kenyon is currently a PhD candidate at the University of Melbourne studying statistical machine learning and working with my team on a casual basis to do some machine learning. Jimmy is a student in the University of New South Wale’s Health Data Science postgraduate degree program. He is working with us supporting work we do with R and gaining work experience. Matt has been working with us to convert models from mobile apps, mostly written in Typescript, to APIs written in .NET.
We also have 3 software developers in the team – senior back-end developer Fumie Horiuchi, senior UX/UI developer Steve Collins and full stack developer Liz Mackle, who completed the UWA code camp just before joining the DPIRD as a junior developer. Additionally, 2 biometricians, Dr Karyn Reeves and Tinula Kariyawasam, support the DPIRD’s research by providing statistically sound research trial designs and trial analysis. They also provide training to staff in biometric analysis methods.
The team currently maintains a suite of 7 decision support tools for crop disease management, released as mobile apps for free in the Google Play and Apple app stores. They are developed specifically to be used by agronomists and farmers, though other researchers are also using them. Here are 3 examples of our spray decision support tool apps, which were developed as a part of and maintained with support from a Grains Research and Development Corporation (GRDC) investment:
We also maintain 2 other sibling mobile apps available for free. One being the PestFacts WA Reporter app. Anyone can use it to submit quick reports or request identifications of insects and plant diseases in broadacre crops and pasture paddocks anywhere in the WA grainbelt. The second app is for New South Wales and Victoria, the PestFacts VIC and NSW app, also for reporting crop and pasture pests and beneficials. Both are part of the broader initiatives PestFacts WA (maintained by us) and PestFacts map (maintained by Cesar Australia).
Fungal disease in crops is of concern to growers and prompts disease control actions. Kenyon is building an object-detection pipeline in Python for identifying tiny mushroom-like structures from photos taken around WA. The pipeline automates the first review of the photos and curates those that need a second look before decisions are made and alerts are made based on the presence of these structures in the photos, which mean that crop disease will soon start to appear.
Used to counter the effects of soil acidification due to common agricultural practices, lime is vital to agriculture, but costly. One of our major projects is building a Monté Carlo model to simulate whole-farm liming for investment decisions. We’re working with the Grower Group Alliance, AxisTech and Curtin University’s Centre for Crop and Disease Management to be able to model a whole farm using actual farm data (WA Farm Data Sharing FA099). Using a new DPIRD API platform, called Extrata, we transfer farmers’ data to be used in modelling liming strategies to our Nimbus instance at the Pawsey Supercomputing Research Centre and generate liming strategy reports, which are mainly used by farmers and agronomists. At the heart of it, we’re using Julia to interface with a .NET API that Matt Foster wrote based on the iLime app. We chose Julia because it’s easy to use while also providing high performance. Matthew Antulov is the main architect of the model despite only having learned Julia since he started working with us. The goal of the project is that this model will support investment decisions beyond whole-farm liming in the future. You can read more about it on the Grower Group Alliance’s website.
The goal of the [WA Farm Data Sharing] project is that this model will support investment decisions beyond whole-farm liming in the future.
We maintain several packages that support agricultural research, and we develop in R, Julia and Python. Most of our daily work is in R, which is certainly what I’m the most comfortable with. We use it in biometrics, especially the ASReml-R package for analysing agricultural research trials. We also use it to conduct Bayesian analysis for plant disease research and evaluate the state of openness and computational reproducibility in the discipline of plant pathology. We also have 2 R packages available as open-source-software via the DPIRD’s Farming Systems Innovation GitHub organisation account.
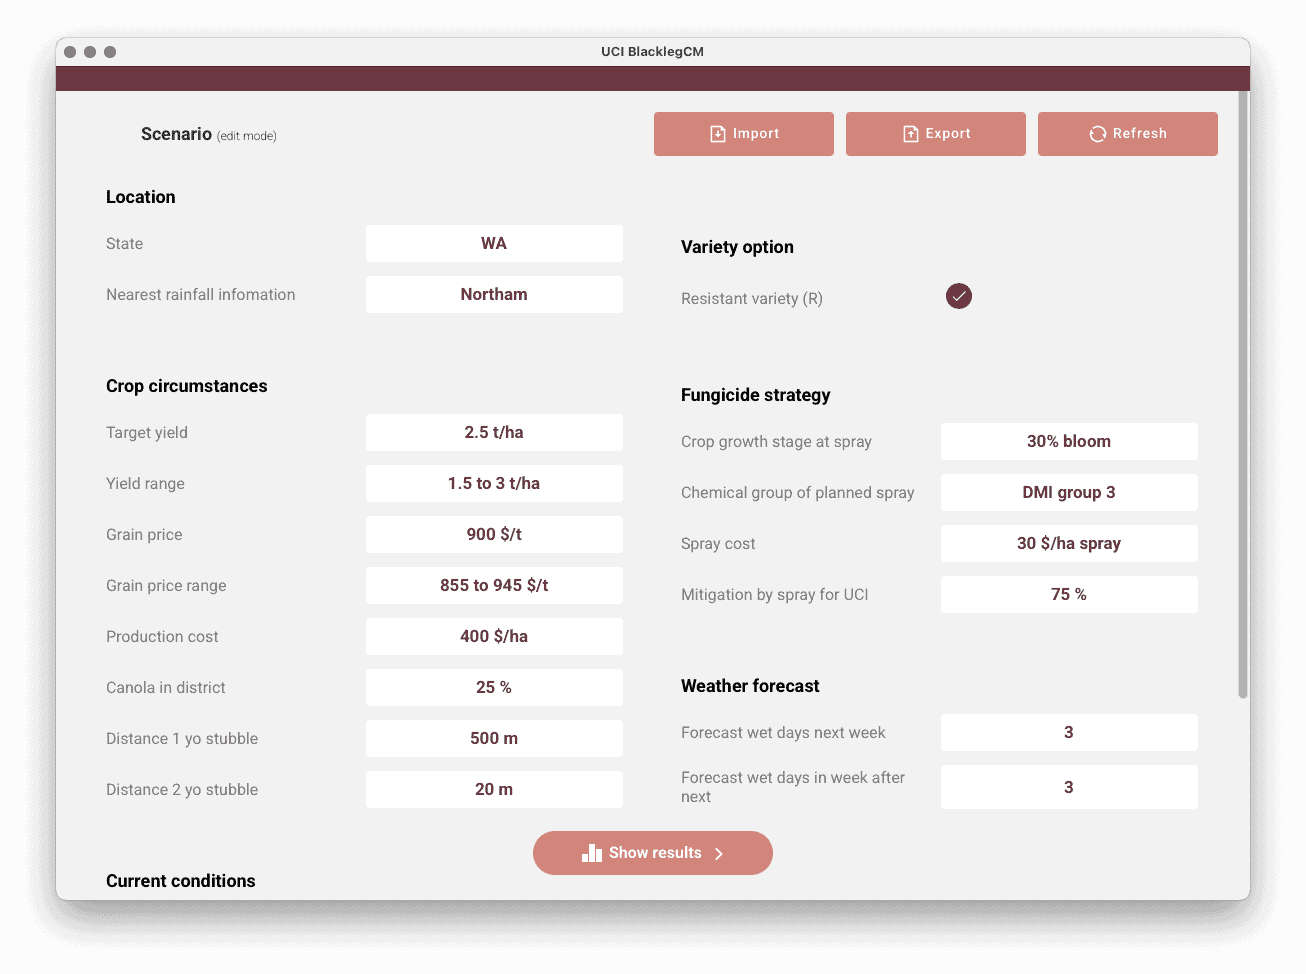
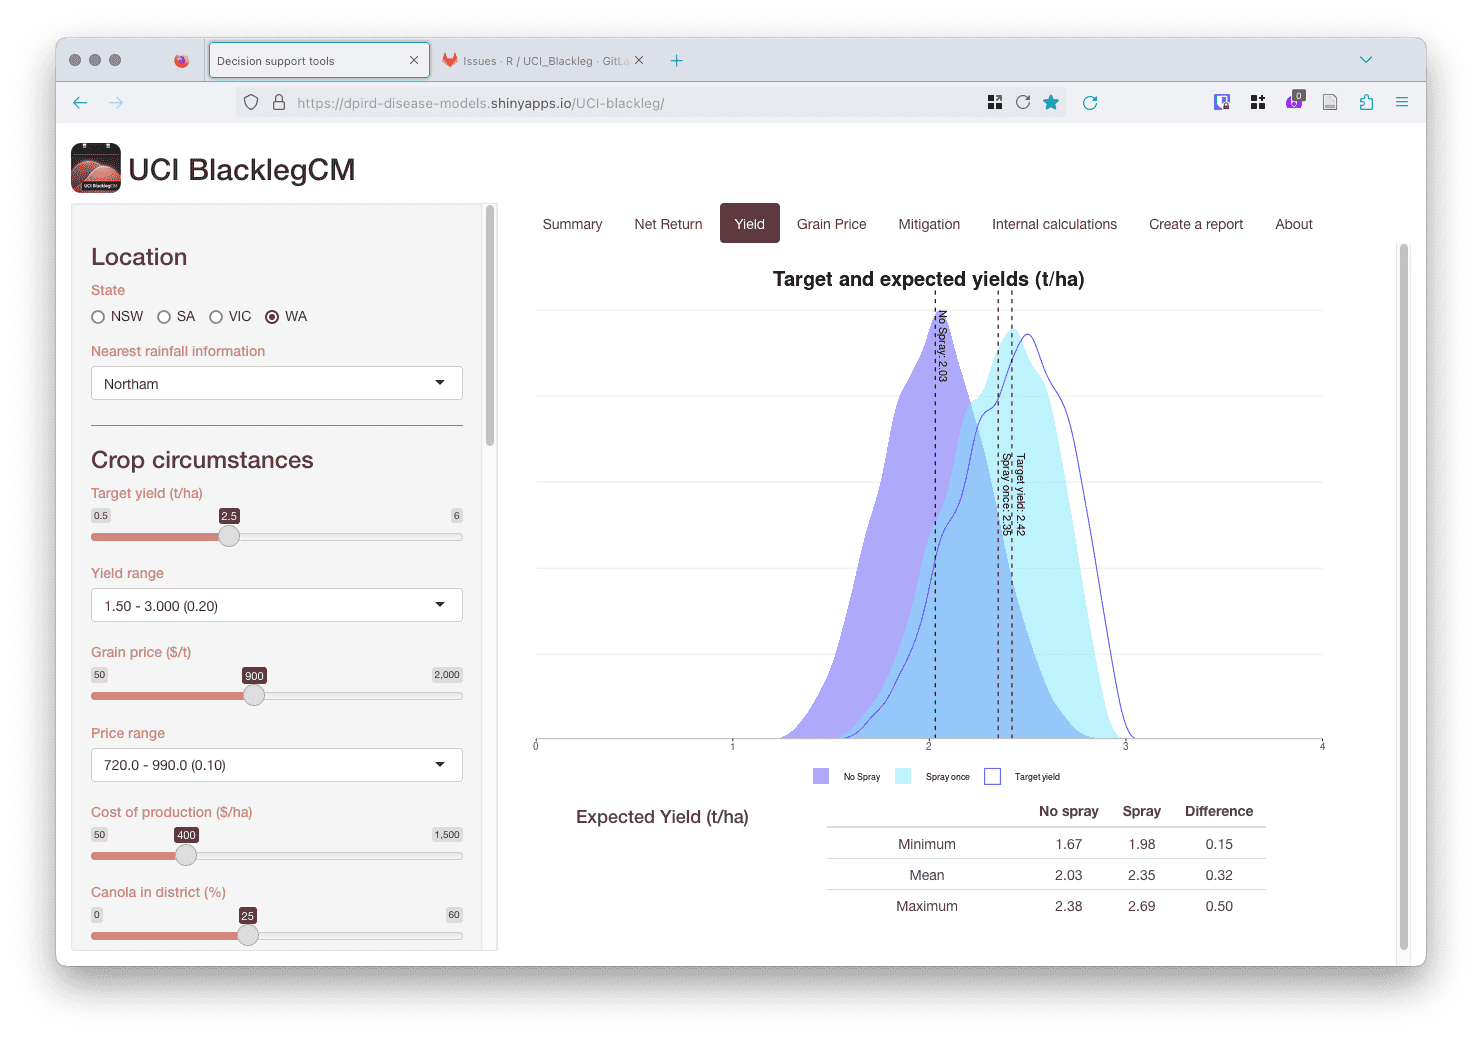
You could say our development process is unique. As I mentioned, we mainly use R in our day-to-day work. Previously, developing models involved having meetings, maintaining spreadsheets and running executable Mathematica code past experts. The R Shiny apps have been a game changer. We now have R Shiny versions of most of the models for prototyping, testing and validation with plant pathology experts before we release them as mobile apps. We like to keep the R versions up to date. This allows us to implement changes to the model and test with large data sets and get user feedback interactively in a reproducible programmatic environment. The model would be modified by Anna, tested in the R version and then translated into an app using TypeScript by Fumie with Steve putting the finishing touches. This makes it easier to conduct unit testing and quicker to deploy changes to receive expert feedback. After the release, Liz would keep the app up to date with changes with Steve and Fumie’s guidance.
The R Shiny apps have been a game changer. We now have R Shiny versions of most of the models for prototyping, testing and validation with plant pathology experts before we release them as mobile apps.
Moreover, it was a pleasant surprise that some of the Shiny apps have been used for teaching exercises by university instructors teaching plant disease epidemiology courses. This is just one example of what one of our Shiny apps look like.
One of the best parts of the job is mentoring the team. Matthew Antulov has been a great asset to the team. He started with us after having only interned with a private mining company and doing some work with Python. It’s been extremely rewarding to see him grow and the quality of his work improve. Some younger early-career members also became mentors to junior members of the team. This led to a strong team dynamic, where someone will always be there to help and there’s no hesitation to ask questions.
Some younger early-career members also became mentors to junior members of the team. This led to a strong team dynamic, where someone will always be there to help and there’s no hesitation to ask questions.
We’re relatively lucky to have the entire team based in our main offices in Perth, rather than spread out. That makes it easier to maintain good dynamics as we can spend time together talking about shared interests. But of course not everyone is in the office at all times, so there’s our Teams chat, which has its fair share of silliness as well as seriousness.
I’m currently a member of the Australasian Plant Pathology Society because of my training in botanical epidemiology and plant disease modelling. I’m also very involved in rOpenSci, where I serve as an Associate Editor for code review for both regular peer review and statistical software. rOpenSci has been a fantastic community to be a part of as an R programmer, and serving as an editor is a chance to give back to the community. While I’m not currently a member, I do also recommend the Statistical Society of Australia, if you’re interested in this area.
If you’d like to be part of the growing community of research software engineers in Australia, become a member of the RSE Association of Australia and New Zealand (RSE-AUNZ) – it’s free!
You can connect with Adam via Linkedin, Github and Mastodon. You can also learn more about him and his research on his personal website.
The winners of the 2023 Venables Award for New Developers of Open Source Software for Data Analytics have been announced!
Presented by the Statistical Society of Australia (SSA) and sponsored by the ARDC, the award encourages new open-source software development from the Australian community with a view to support efforts to develop and share data science and statistics methodology. Learn more on the SSA website.
Stay tuned for the August instalment of our Shaping Research Software series, which will feature Matthew and Andrew.
The winner of the inaugural Emerging Leaders in Astronomy Software Development Prize has also been announced!
The prize is presented by the Astronomical Society of Australia (ASA) and sponsored by the ARDC. Learn more on the ASA website.
The winners for this year’s New Developers of Open Source Software in Ecology award will be announced at the 2023 Ecological Society of Australia Conference, which will be held in Darwin from 3 to 7 July.
Learn more about the ARDC’s Research Software Agenda for Australia.
The ARDC is funded through the National Collaborative Research Infrastructure Strategy (NCRIS) to support national digital research infrastructure for Australian researchers.